Back to Basics/ Apartment REIT concepts
It has been brought to my attention that readers might benefit from a distilled version of the framework/concepts I use in evaluating apartment REITs. Here I discuss:
1. basic supply & demand for apartment markets and discuss how this impacts rents
2. the renter pool in gateway cities vs. sunbelt - to what extent can renters easily become homeowners?
3. easy ways to estimate replacement cost - comparing replacement cost to the cost of purchasing apartments through REITs
4. the three classes of apartments (A, B, C) and how each class typically performs in various economic conditions and in response to new supply
5. why private market value is the most relevant & reliable way to estimate apartment REIT value
6. private market approach to financial leverage & balance sheet management
7. summary of some risk factors associated with apartment investing
- Supply constrained vs. Non supply constrained markets
There are some markets where there is very little new supply coming to market - this is a very good thing for apartment owners. The lack of supply is generally due to a confluence of factors including: strict zoning, lack of land availability, and/or prohibitive construction costs. LA/SF/Boston are great examples of this - zoning restrictions (CBU - Can’t Build Up) have lead to a lack of building/chronic housing shortages. The economic consequence of restrictive zoning in LA/SF is very high housing prices (and strong housing price growth) over multiple decades. Similarly rental rates are high and rents grow faster than most other places because when demand increases, supply stays relatively flat and therefore price (rent) must go up.
In many sunbelt markets (Atlanta/Dallas/Houston/etc), zoning is permissive, land availability is greater, and construction costs are lower. While demand (population growth) in these markets is very strong, over time, meaningful amounts of supply enter the market to meet that demand. This puts a lid on rental rates/rent rate growth.
2) Renters by choice vs. Renters by necessity
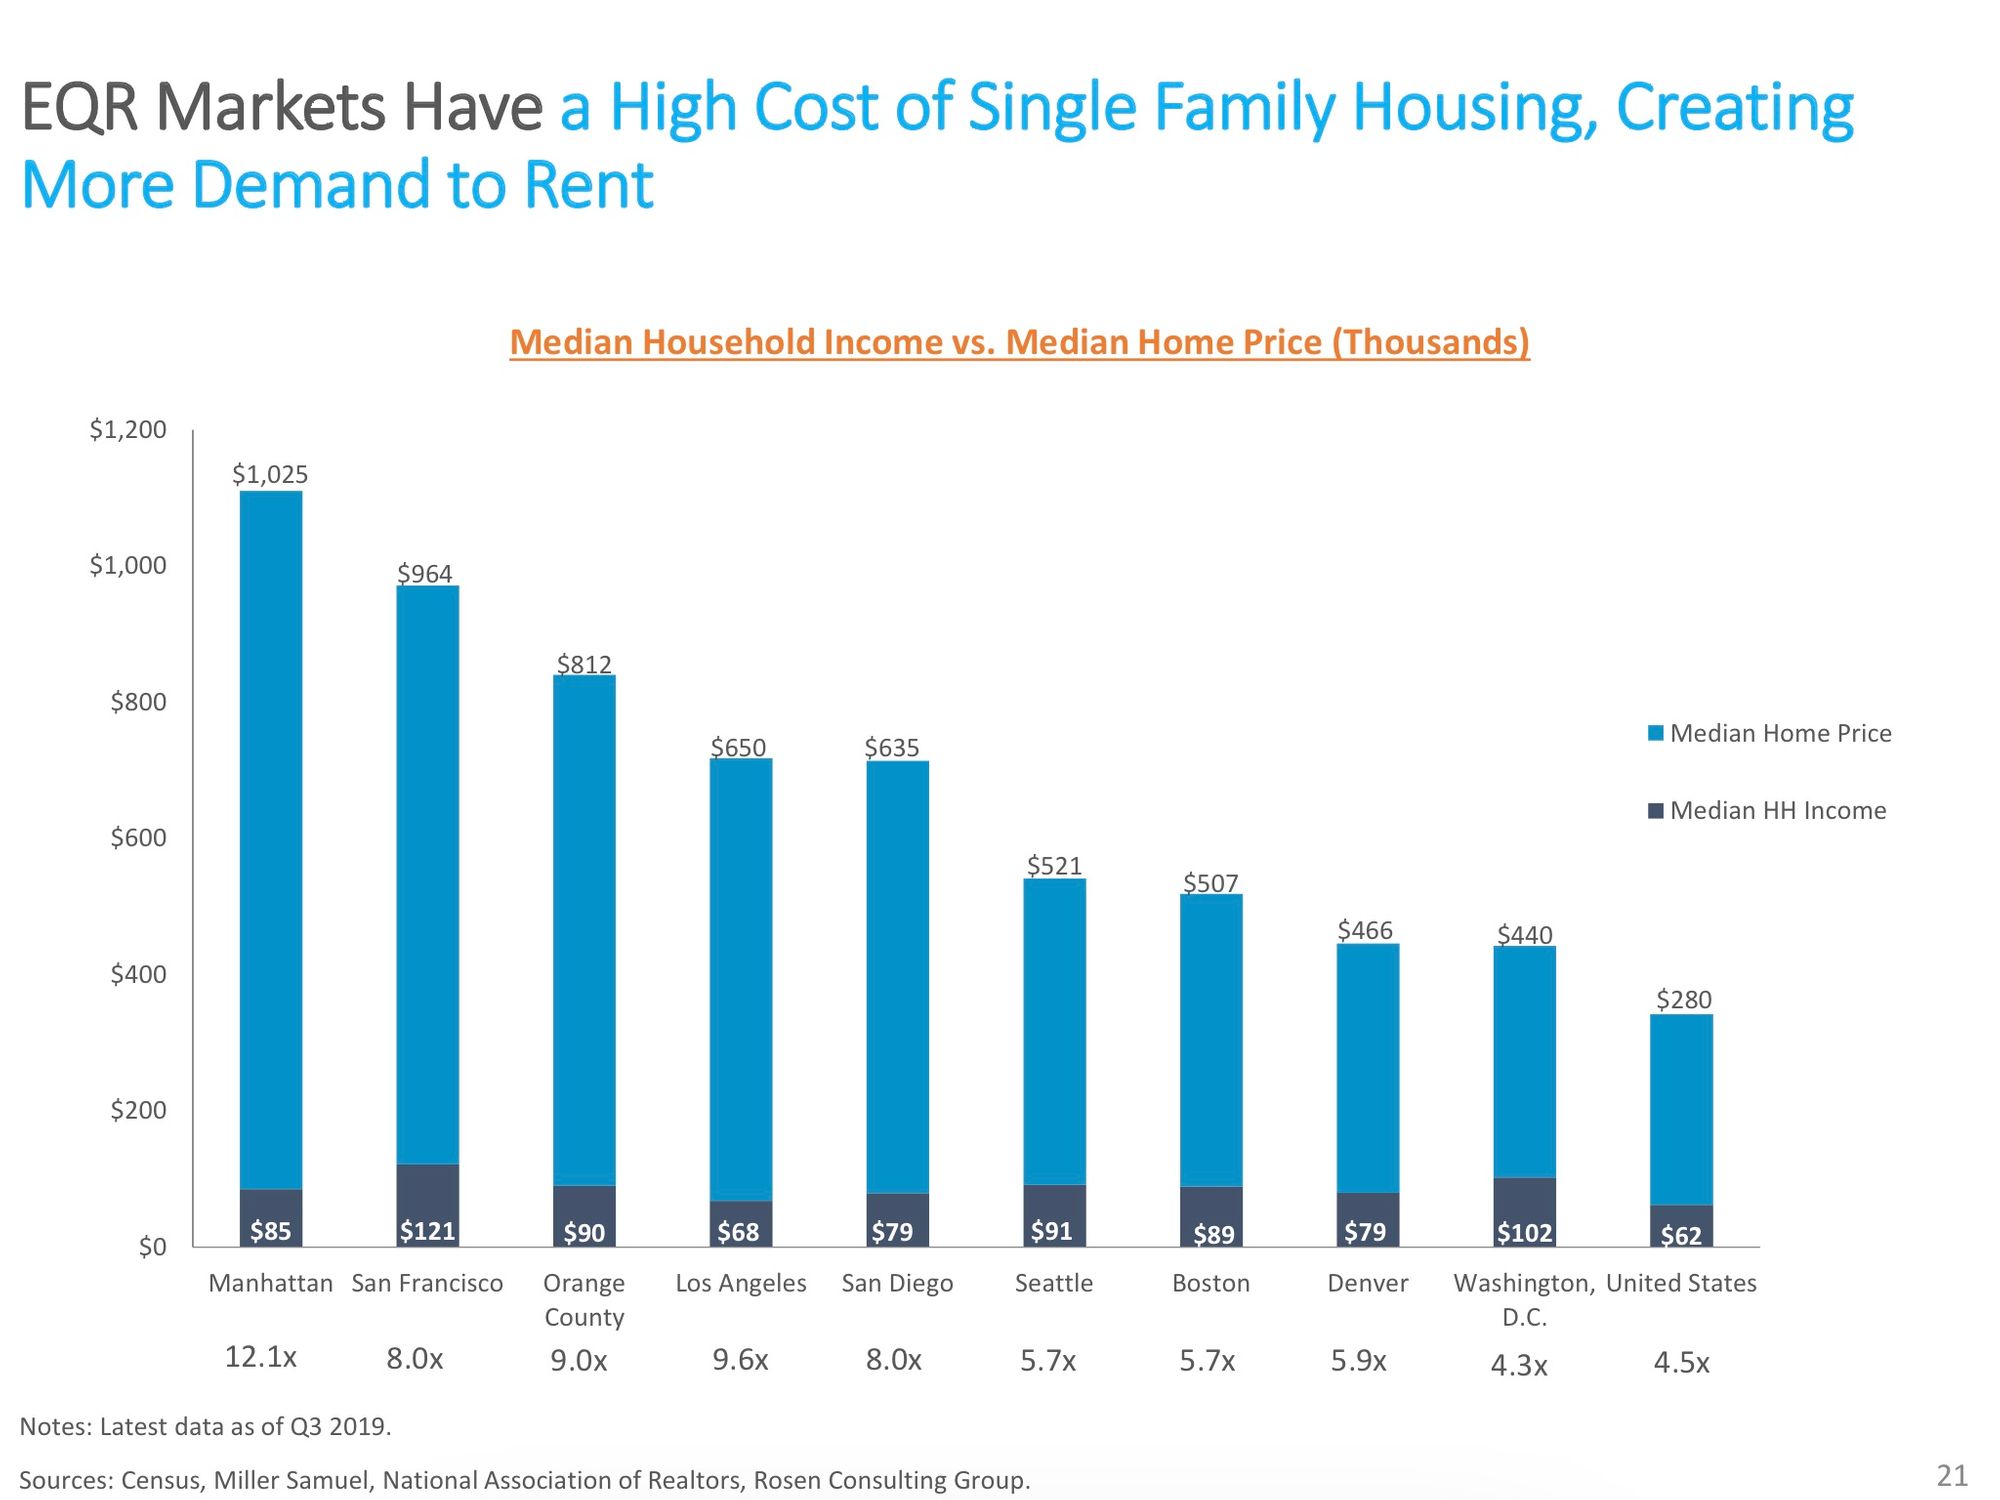
Many coastal markets, like SF/LA/NY, have incredibly high housing costs (average near $1 million). This prevents many residents from ever becoming home owners and creates a ‘renter by necessity’ dynamic whereby a large percentage of the population have no alternative to renting.
In the Sunbelt, housing is much more affordable and within reach for a larger percentage of the renter pool. Many residents who can afford to purchase housing still choose to rent - in some cases because of the greater flexibility/reduced responsibility assocated with renting vs. owning. All else equal, it is better to have renters by necessity (less competition from home ownership)
3) Replacement cost comparison - what would it cost to build today?
Most of the apartment REITs have a development operation to create new units. Quarterly supplements disclose the total cost of the build-out as well as the number of units built. This allows us to calculate the cost of new supply coming into the market. This is useful information in: A) assessing the outlook for competitive supply (which will impact rental rates) and (B) comparing the implied price/valuation of the REIT’s apartments to the cost of competing supply. I always want to buy at a discount.
Today the cost of new build in LA/SF is $500-750k per unit and $225-300k per unit in most sunbelt markets. This is for brand new construction of course (A+ or luxury). So naturally the price But this provides a pricing umbrella to existing supply as high cost new supply requires higher rents to achieve targeted returns.
I can calculate how much I am paying per apartment by taking the enterprise value (sum of market cap + debt +/- adjustments) and dividing by the total number of units. I compare this number to 1) private market transactions on a per unit basis (total transaction value / units) and (2) the cost of new supply.
To give a simple example, today if I purchase shares in the Essex Property Trust (ESS), I am buying each apartment for $377,000 per unit. Comparable transactions in the markets in which ESS operates have occurred around $500-600,000 per unit over the past 6 months. Similarly, from public disclosures we can see that development costs are $500-800,000 in these markets. This tells me that I'm buying Essex at a large discount to both private market transactions and replacement cost.
4) Apartments are generally broken into three classes - A, B & C:
A - relatively new (less than 15 years old), priced near the top end of the market and offer the full range of amenities; Class A apartments tend to be the most economically sensitive as renters trade up to nicer apartments in strong economies but may trade down in weaker economies. Class A apartments are the most vulnerable to the impact of new supply entering the market.
B - generally 15-30 years old, priced at a 15-25% discount to A units of comparable size. Because Class B units are less expensive than Class A, rents/occupancy tends to hold up better in economic downturns as these units offer less expensive rents than Class A. Class B &C is not subject to competition from new construction as development is ALWAYS focused on Luxury/Class A (Class B would never pencil out and new Class B is NEVER BUILT). Class B assets located in the best locations tend to see very good long term rent growth as the units can be upgraded (typically at a cost of $10-15k per unit) and rents can be hiked (while still priced at a meaningful discount to new construction/Class A assets). The negative for Class B assets is that because the building/units are older, there is typically a higher ongoing maintenance capex requirement.
C - typically 30 years or older; less desirable locations/few, if any, amenities. Priced at a 25% or greater discount to A units.
5) Valuation - why I use the private market and not P/FFO
In some industries, publicly traded companies dominate the industry and represent the majority of the supply in the industry. In this case, the valuation of similar public companies is a relevant starting point in assessing the relative valuation of a company/set of assets. However, in other industries, publicly traded companies/REITs represent a tiny fraction of the market. In this case, the relevant comparison is the valuation of similar businesses/assets in the private market.
Only 5-6% of apartment assets in the US are owned by REITs (publicly traded). The other 94-95% is owned privately. This means that the PRIVATE MARKET is the REAL MARKET for apartment assets in the US. Thus we need to look at private market values to determine whether an apartment REIT is fairly valued.
Private market transactions are typically valued on a cap rate basis. The cap rate is simply the Net Operating Income divided by the total price paid for the building. A lower cap rate means a higher price (cap rate akin to the inverse, 1/x, of the EV/EBITDA multiple). Cap rates tend to follow interest rates over time - One metric which tracks this is the Cap Rate Spread. The Cap Rate Spread is the Cap Rate less the 10 year Treasury rate (Cap Rate Spread = Cap rate - 10 year Treasury rate).
Currently (and for most of 2020), apartment REITs trade at meaningfully higher cap rates (lower valuations) than it would cost to buy the apartment assets in the private market.
6) Balance sheets
First and foremost, lenders want to be sure that if things go bad, the loan is repaid (one way or another). When real estate lenders look at the creditworthiness of apartment assets, they tend to be most concerned with the value of the loan vs. the value of the property. Dividing the value of the loan by the value of the property we arrive at the LTV or Loan To Value ratio.
In the private market (which as mentioned above is the most relevant market for apartment assets), LTVs for stabilized assets (not lease ups or development projects) typically range between 60-80%. If we consider the high end of that range, an 80% LTV loan, in order for the lender to incur a loss, this means that the total value of the property must fall 20%. This would be a rare occurrence in the apartment space. Apartment buildings tend to have stable and growing cash flow which supports property values.
Because private market operators use higher amounts of financial leverage (debt financing is inexpensive with debt costs ranging from 2.5-3% today), they are willing and able to pay higher prices (buy at lower cap rates) for apartment buildings than REITs and still generate solid returns on equity. Here is an example.
7) Risk factors
-Rent control - this is a concern mainly in CA/NY. CA currently caps rental hikes for renewals at CPI +5% (with a limit of 10%). Some municipalities have even more stringent rent control. For instance most properties in LA County built before 1979 have strict limitations on renewal rent hikes (3-8% per year, dependent on CPI) . In Nov 2020, there was a ballot initiative (Prop 21) which sought to expand municipal rent control powers but it was firmly defeated (~60% voted 'NO'). Rent control/threat of rent control is generally not a concern in Sunbelt markets.
-Property taxes -use 2018/2019 MAA as an example. Some regions, like CA or MA, have well defined property tax regimes which are favorable to investors. For example, in CA, Prop 13 limits property tax increases to a maximum of 2% in any given year. In other place, particularly Sunbelt markets (which are more dependent on property taxes given low/no state income taxes), property tax increase tend to be 1) higher than 2% and (2) more volatile - property tax hikes depend on a variety of factors but usually incorporate appraisal estimates - when multihousing values increase so do property taxes.
-Supply - as noted in Point 1, some markets like CA, MA, and NY are supply constrained. Other markets, particularly in the Sunbelt, are subject to meaningful amounts of new supply.
- Interest rate risk - as mentioned in the valuation section, cap rates tend to move with interest rates. Currently the spread is at/near the high end of its historical range, providing some cushion against a rise in interest rates. However, should interest rates increase substantially, cap rates for multihousing are likely to rise. Interest rate increases are usually related to inflation/inflation expectations. As an offset, apartment rents reprice annually providing a hedge against inflation.
-Demand weakness - weaker household formation driven by poor economic growth/lack of job creation
Private Eye Capital Newsletter
Join the newsletter to receive FREE actionable investment ideas.