
Updated Multifamily Cap Rates/Per Door/IRR Ests
With the large multifamily REITs having reported, I went ahead and updated my cap rate, per door, IRR estimates as shown below:

Methodology/Assumptions:
- Cap Rate shown uses current expected 2024e NOI (based on company guidance given over the past two weeks) and deducts 'Property Management Expenses'.
- I assume 2-3% NOI growth over the forecast period for all the REITs shown above which is 100-150 bps more conservative than w/ LT historical averages. This takes into account current weakness. Excluding AIR Communities which has a meaningful earn-in benefit, 2024 guides range from -1.3% (MAA) to 1.8% (EQR). Rental growth should be relatively steady for the coastal markets (again due to limited supply) though 2024 will be weaker than a normal year as NorCal/Seattle are suffering as tech hiring remains weak. A deluge of new supply will cause the sunbelt to see weakness in 2024-2025 which I expect to be followed by a bounce in 2H26 to 2028 (given my expectation of very low apartment starts in 2024 leading to scant deliveries in 2026-28 but continued population growth). Dramatically reduced supply expectations from 2026-28 are a function of higher interest rates, higher construction costs, curtailment of CRE/development lending particularly on the part of regional banks. Consider the possibility that regional bank difficulties (regional banks are one of the largest sources of development financing) and 'higher for longer' interest rates constrain new supply and are a friend of the long-term owner of multifamily assets.
- To determine IRRs, I use a 5% cap rate for coastal / 5.5% cap rate for sunbelt for 2028e NOI and take into account dividends as well as expected cash build (dividend payout ratios generally sub 75% on AFFO). Historically coastal apartments have traded 75-125 bps tighter than sunbelt REITs due to limited supply/renter-by-necessity dynamic leading to more stable expected results. This changed during COVID which saw declines in coast NOI/FFO & a boom in the sunbelt which altered investor appetites (i.e. more capital flowing to sunbelt and out of coastal). For a brief period, sunbelt multifamily traded at lower cap rates than coastal. As you can see in the table above, cap rates have since reverted to something closer to their historical relationship (i.e. sunbelt now trades at a discount to coastal) as fears about sunbelt supply are front & center.
- There are puts and takes here re sunbelt vs. coast. As everyone knows, demand growth is stronger in the sunbelt (jobs/population) and regulatory risks are limited/nil. Coastal markets have flat/declining populations and regulatory/rent control risks (as well as implementation of onerous transfer taxes like we saw in LA) but benefit from very low supply growth in CA/NY/Boston, lower levels of property tax growth (Prop 13 in CA and something I forgot in MA) and very expensive housing (renters by necessity even at $200+k annual earnings).
- The COVID sunbelt housing boom has driven housing prices up considerably faster than household incomes (home prices have gone from ~3.5x annual household income pre-Covid to 4.5x+ today) creating more of a renter by necessity dynamic (particularly as mortgage rate hikes have further increased the cost of home ownership). Relative to being a homeowner, it has rarely (if ever) been more financially advantageous to be a renter. To the extent that this is a medium/long term trend, it is supportive of lower exit cap rates for sunbelt multifamily.
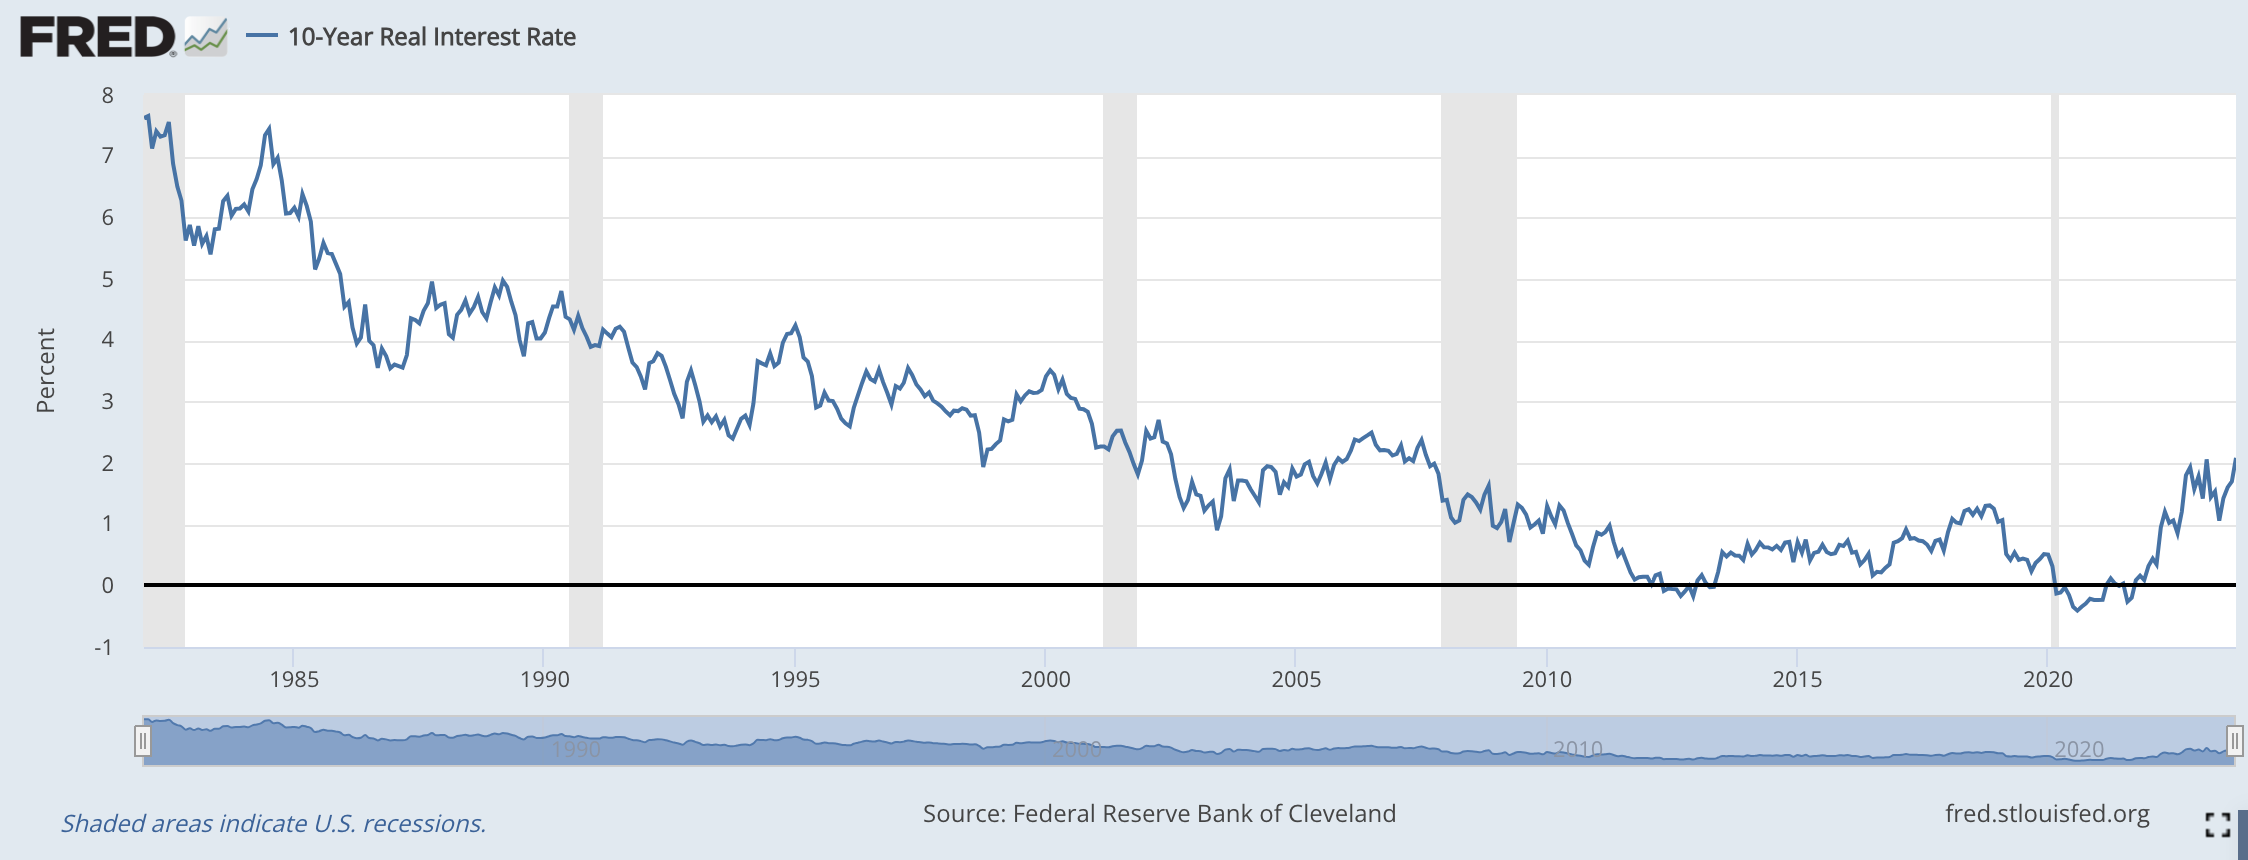
- Surely some of you probably think that 5-5.5% is an aggressive 'exit cap' assumption. My thinking here is that a 5% cap rate should generate an un-levered, real (after inflation, assuming inflation is equivalent to NOI growth in the long-term) return of around 4.25% to the buyer. 4.25% is 85% of 5% with the 15% representing the difference between nominal and economic cap rates (i.e. G&A and maintenance capex). I see a 4.25-4.75% real return to be pretty fair for what I believe to be a diversified collection of low risk assets (10y Treasury real return shown below). If you assume a cap rate 0.5% higher (so 5.5% coastal, 6% sunbelt), the 4 year expected IRR declines something like 3% (i.e. 15%->12%).
Why am I so excited about these dumb apartment REITs? Risk/ Return & downside protection. The balance sheets here are very low leverage (6x ND/EBITDA works out to like ~32% LTV). Properties are very high quality. No obsolescence risk like office. I see these as incredibly low risk assets with a very good chance of returning low to mid teens IRRs over a 4 year horizon. Even if you cut my rent growth assumptions in half and assume 6/6.5% exit cap rates (both draconian IMO), we are still talking about 8-9% IRRs. Pretty, pretty good.
Disclaimer:
- This report is NOT investment advice and should not be read by anyone. It's entirely possible that I'm wrong about absolutely everything in this post. Do your own work.
- I own shares in securities mentioned in this post.
Song:
Private Eye Capital Newsletter
Join the newsletter to receive FREE actionable investment ideas.

